by Russell Shor
How to trade the FTSE 100
The FTSE 100 has had a strong 2025 so far, gaining 16% year to date. The index trades at around 18 times earnings and offers a dividend yield slightly above 3%, supported by forecasts of £80 billion in dividends and more than £39 billion in buybacks. Its heavy weighting in banks, energy companies, miners, and consumer giants means profits remain closely tied to global growth and commodity prices. With interest rates at 4%, inflation at 3.8%, and gilt yields near 4.7%, dividends and buybacks continue to underpin valuations even as they appear stretched. From here, we examine three hypothetical technical scenarios for how the market may develop.
FTSE100 Technical Analysis:
Peak and Troughs
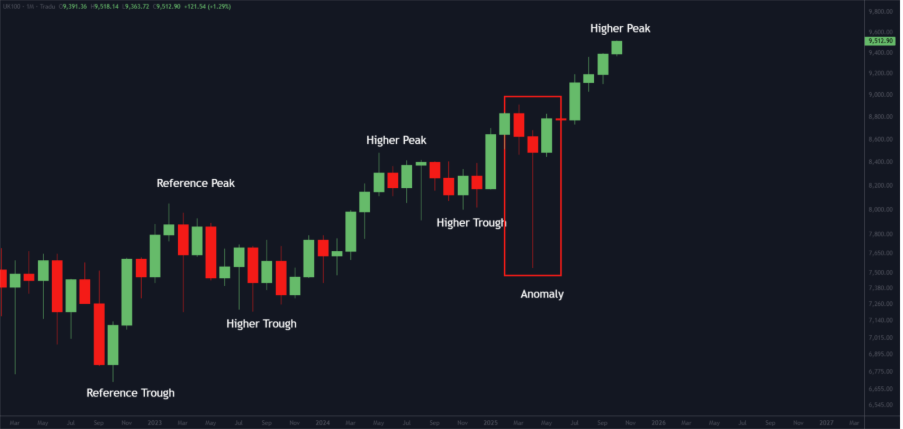
Tradu’s FTSE 100 CFD, UK100, has broadly maintained a pattern of higher troughs followed by higher peaks since its reference trough in October 2022 and its reference peak in February 2023. There were periods where labelling was more complex, yet the overall trend has been clear.
April was an exception. When President Trump announced reciprocal tariffs on “Liberation Day” (2 April), the index sold off sharply. A week later, however, a 90-day pause was announced, and the market staged a recovery. By the end of the month, the index had pared most of its losses and was down only about 1% for April. The bears had been forced out, and the bulls lifted prices well above the early April lows.
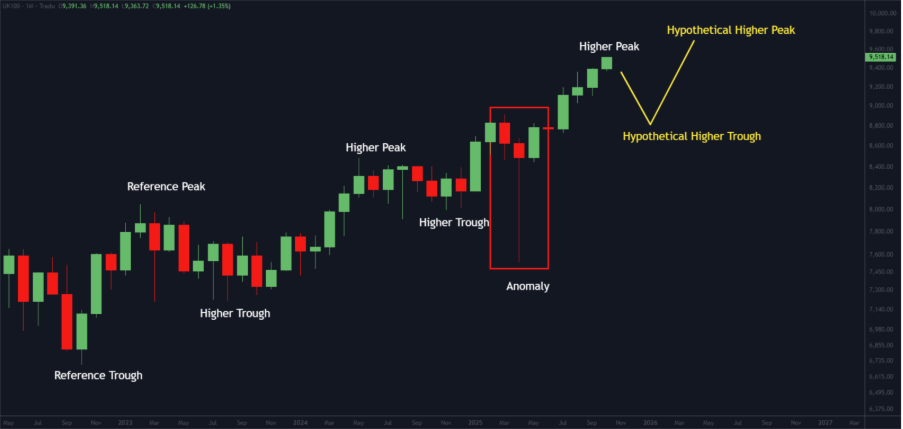
A Continuation of the Trend Scenario
If weakness sets in and a pullback develops, the key question is whether another higher trough can be established. Should that occur, the uptrend remains intact and would likely pave the way for a new higher peak. In this scenario, the series of higher troughs followed by higher peaks continues, reinforcing the existing bullish structure.
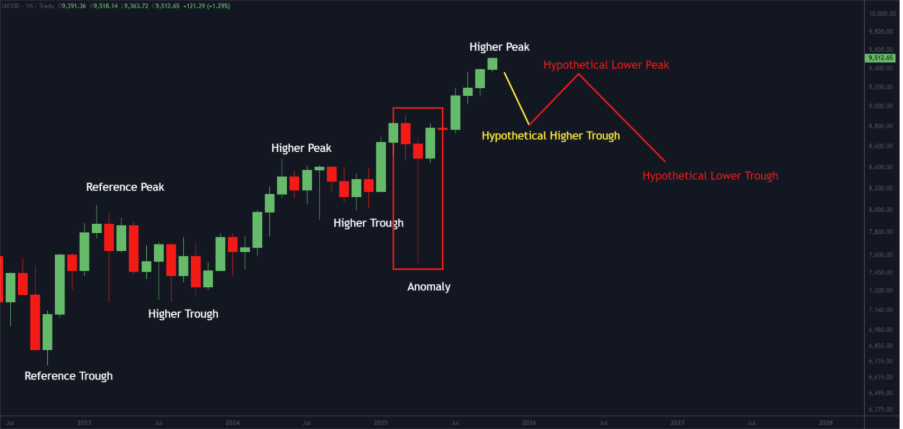
A Reversal of the Trend Scenario
A second possibility is that the market is close to a peak and that a reversal is looming. In this case, a higher trough could still form initially, but the bulls may lack the strength to push through the previous peak. Instead, a lower peak would emerge, signalling potential fatigue.
The real risk comes if bears then drive the next leg below the prior trough, creating a lower trough. This outcome would effectively resemble a head-and-shoulders formation, a classic sign of a trend reversal.
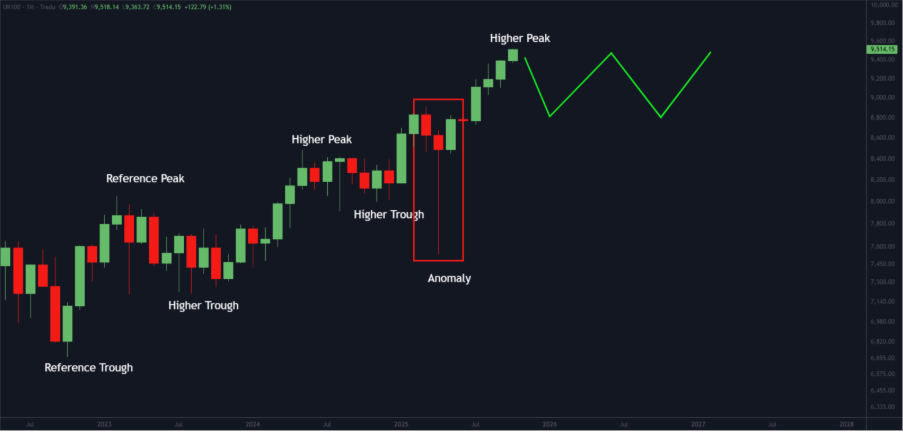
The Trend Consolidates Scenario
A third option is that neither side gains the upper hand. If demand and supply balance, price action could settle into a sideways consolidation. This may take different forms, with a rectangular trading range being one likely outcome. A decisive breakout or breakdown from this range would then provide the signal for the next directional move.
Conclusion
The FTSE 100 has delivered solid gains this year, but the next stage will depend on how price action develops against a challenging backdrop of tight valuations, elevated rates, and shifting fundamentals. Whether the index extends its series of higher highs, signals a reversal through lower peaks and troughs, or pauses into a consolidation phase, each scenario carries distinct implications for investors and traders alike. Careful monitoring of peak and trough behaviour will be key, as the eventual breakout or breakdown will set the tone for the market’s next decisive move.