For the past couple of weeks we have been a little cautious on the markets as price had seemed over stretched on the recent optimism, this bearish skew was strengthened with the Hindenburg Omen being triggered which highlighted how so much of this move was down to just a few names in the index and not due to broad buying right across the market.
But the power of these few names has been too strong in recent days, so despite ongoing concerns that the strength is rather too concentrated to be ideal, there is still underlying buying interest.
The index dipped marginally early last week but buyers quickly returned and lifted the index up to fresh all-time highs as the concerns over the US economy over the longer term are being outweighed by hopes that the Fed will have room to cut rates later in the year.
The major concern for the week ahead is the serious risk that President Biden may yet drop out of the election race and could even step down as President due to his now impossible to ignore serious mental decline. Previously the administration, and much of the US left leaning media, had played down this mental decline as they believed he was still able to win the election.
After the truly disastrous debate performance all hopes of this has faded. So now the US media has started to turn on Biden as they can see another Trump presidency looming, as the outcome of a Trump vs Biden contest is clear. So now finally the US media is putting pressure on Biden to step down, not because they were not aware of this before, but because now they cannot lie enough to cover it up anymore.
This could well cause a significant shock to the markets and increase volatility as the probability of another Trump presidency gets priced in. So traders do need to be wary of possible volatility ahead.
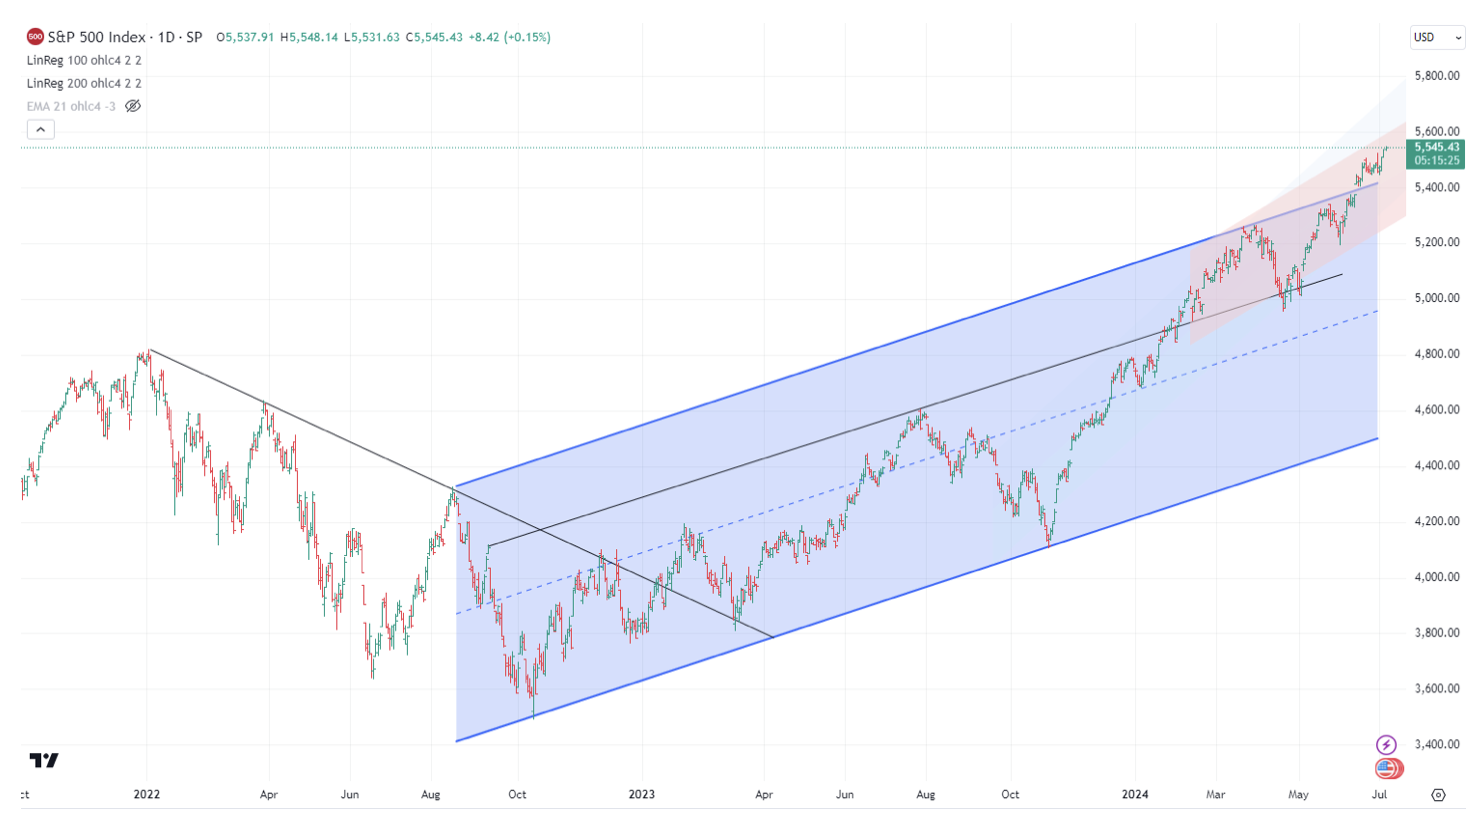
This volatility could be a near term shock to the down-side due to the strong short term trends which may have over extended. We would not turn outright negative however until/unless support areas are broken, currently down around 5420. Moves under here would drop the index back into the previous trading range, blue region on chart.