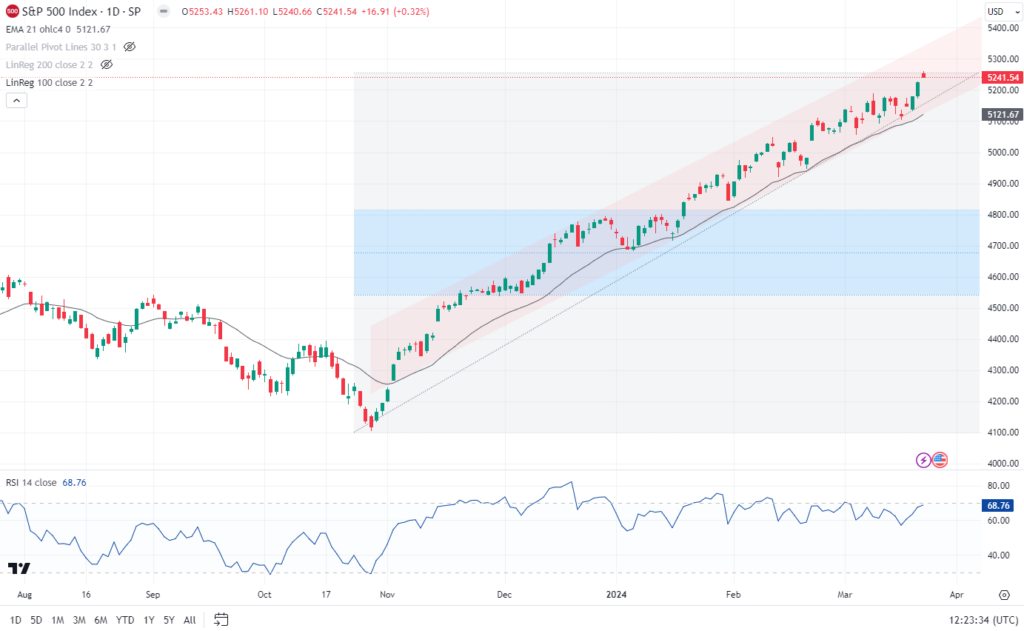
In the first of our weekly reviews, we will take a look at how the S&P 500 sits currently. The chart describes how price action has been in an extremely tight bullish trend since the lows in October last year. Ever since the Fed started to suggest thatthe rate hiking cycle had peaked and that rate cuts were looming, the market has seen steady and consistent buying.
On this chart we also throw up a Fibonacci retracement channel calculated from the October lows to the recent all time highs. This is not meant to be a forecast of where price action will fall to, but instead it is meant to highlight where the index could fall to.
After a strong move like this it is quite common for price action to retrace around 50% of the previous move. The 50% level currently is around 4,700.

Were this to happen in the coming months you will doubtless read many reports of “The S&P 500 is crashing”. In reality this would only be a fall of around 11% and the long term bullish trends would remain intact, so it would not be a major long-term concern. So
investors and traders alike need to be aware that a simple relatively minor correction down towards the 4,700 could occur in the coming months, if the Fed for example was to push back hopes of future rate hike cuts.
There are wider concerns on the underlying state of the US economy, there is plenty of anecdotal evidence to suggest that the US consumer is starting to feel the pinch. However the top tier companies in the S&P 500 have so far been largely immune to this effect.
So, unless/until more evidence emerges the extremely strong bullish trend looks set to continue. In order to turn more cautious we would need to see price action drop out of this trend, currently around 5100. As this would be the first warning sign of a more meaningful correction.
As things stand though the short and medium term trends are strong, leading to a positive skew on the index and its constituents, and that on any future weakness a move towards 4,700 would seem to be a natural move.
