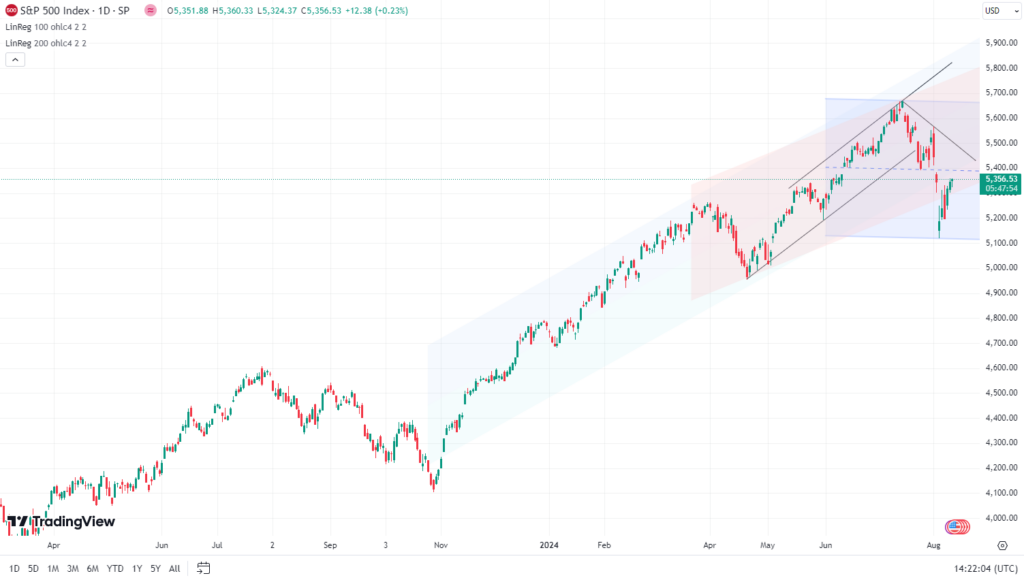
The markets continue to recover from the major concern recently over the Japanese carry crade breaking down.

What is interesting is that after the index broke under the 5,400 area it quickly moved the same distance again to the downside, as shown by the blue region in the enclosed chart. Somewhat reminiscent of how a head and shoulders pattern can break lower the same size as the previous head.
So the rally from the 5,100 has not come as a major surprise. What it does do is leave the burning question: Is this the start of a more meaningful recovery back to recent all time highs, or merely a near term blip before the selling returns?
As mentioned last week we do now have concerns that the July all-time highs could be the highs of the year, and that we have now entered into a “sell into rallies” phase. The first real test of this hypothesis will arrive if/when the index moves back towards the 5,400 area.
This is not only just the previous break level, but is also coinciding with the new negative trend line calculated from the July highs. If the market is able to break back above 5,400 then, alright, we would return to being more outright bullish again, and can see the market shaking off the recent concerns.
For the moment though we feel the balance of probabilities has shifted to a more negative stance and our expectation is that any move up towards the 5,400 could run into serious selling pressure.
So in the very near term this buying momentum may continue, a little, but the 5,400 needs to be conclusively broken for us to shift to a more positive medium term.
