Executive search firm Norman Broadbent (LON: NBB) revealed at its AGM that second quarter trading is materially ahead of the same period last year. Recent appointments are helping to enhance growth, and the company is moving into the Middle East market. This should ensure a return to profit this year. The £96,000 CBILs loan has been repaid. Shareholders approved the 35-for-one share consolidation, and it was well-timed considering the good news. The adjusted share price improved 45.3% to 147.5p.
TheWorks.co.uk (LON: WRKS) improved sales and margins in the fourth quarter and guidance has been upgraded. EBITDA for the year to April 2025 has been raised by £1m to £9.5m on flat revenues compared to £6m in the previous year, while the 2025-26 figure is increased to £11m despite the National Insurance headwinds. Net cash has improved to £4m. The share price rebounded 41.4% to 38.6p.
Ironveld (LON: IRON) says sales of DMS grade magnetite from its Bushveld project to offtake partner Sable Platinum should commence shortly. Production ramp-up from stockpiles is underway and the product meet market requirements. Demand is exceeding expectations. Ironveld is set to shift from a development company to fully operational business. The high purity iron, vanadium and titanium project is on the northern limb of the Bushveld Complex in Limpopo, South Africa. The share price increased by two-fifths to 0.0525p.
Chain manufacturer Renold (LON: RNO) has received two bid offers one is 77p/share in cash from Webster Industries and the other is 81p/share in cash from a consortium comprising Buckthorn Partners LLP and One Equity Partners IX, L.P. The share price rose 38.6% to 74p.
FALLERS
Healthcare services provider Totally (LON: TLY) is considering offers for subsidiaries. This is the only practical way to pay off liabilities. However, the proceeds may not be enough to meet all liabilities. The share slumped 79.3% to 0.3p.
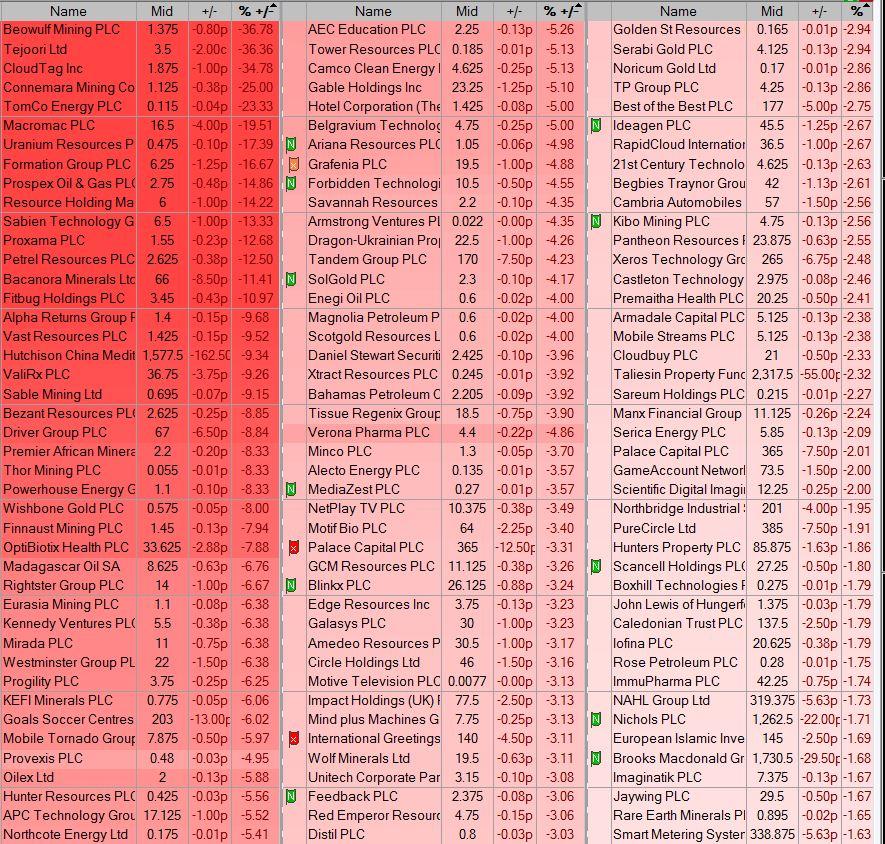
There was significant disappointing news from Pantheon Resources (LON: PANR) during the week. First, an initial unstimulated flow test from Megrez-1 in Alaska showed production dominated by water, which was consistent with the previous test in the area. Management will assess the data, but it currently says no recoverable oil resource should be associated with the Lower Prince Creek interval. Second, the flow testing of the Lower Sag 3 reservoir level in the Megrez-1 well was also disappointing. The well is suspended. The focus will switch to Ahpun West, and the Dubhe-1 well will drill this year. Final investment decision on Ahpun West should be in 2027. The share price dipped 41.6% to 24.75p.
Ascent Resources (LON: AST) is acquiring a 49% interest in oil and gas leases in Colorado operated by Locin Oil Corporation and a 10% in oil and gas leases in Utah operated by ARB Energy. US-based geologist David Patterson will take over as chief executive and there will be cost savings. The first purchase costs $2.5m, including shares at 0.5p each and a $1.9m convertible loan note. The second purchase costs $750,000 in shares. The deal includes rights to earn a 50% economic interest in incremental production from these leases. There is an option to acquire a further 23% interest in the leases. A fundraising will generate £1.35m at 0.5p/share with £224,000 used to pay back part of the RiverFort secured loan with $100,000 converted into shares at 0.7245p/share. The share price decreased 38.2% to 0.525p.
Cybersecurity software company Acuity RM (LON: ACRM) raised £421,000 at 1p/share. This will finance sales and marketing, plus further product development. The share price slipped 25.9% to 1.075p.


