
Sponsored Article
Over the past 18 months, the US dollar’s been on a tear.
And from a charting viewpoint, there’s been a clear trendline supporting the price since May last year.
Every time the price came down to test that trend line, the buyers came in and the dollar moved higher again.
When you see a market bounce like that at support, it’s the sign of a strong trend.
But when that support gives way, it’s a sign that the trend may be in danger of ending… and a new trend beginning.
That could be what we’re seeing right now, thanks to the Fed.
Below is a chart of the US Dollar Index. That’s a measure of the value of the dollar relative to a basket of international currencies, including the pound, the Euro and the Japanese yen.
You can see the blue trendline I’ve drawn showing the dollar bouncing on five separate occasions over the past year.
It shows the dollar has been strong in relation to other currencies.
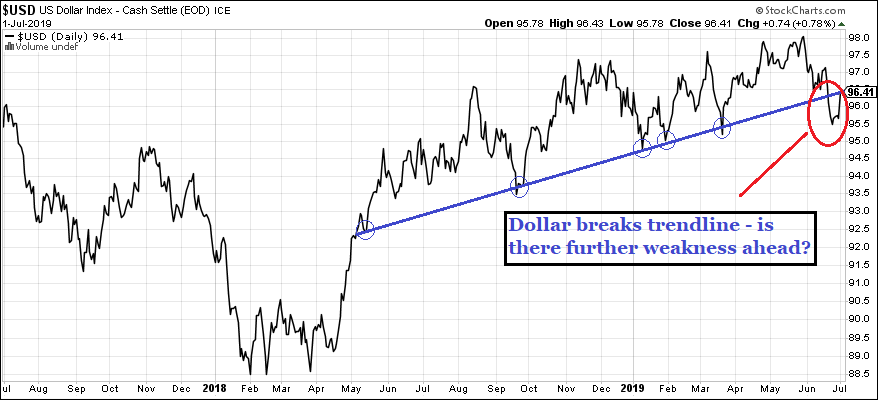
That’s until 19th June (circled in red), where the dollar price breaks down significantly below the trendline for the first time April 2018.
Now 19th June is a significant date.
It’s the date of the latest policy announcement from the Federal Reserve.
The Fed left its key US interest rate on hold at the 2.25-2.5% range, as analysts had widely expected.
But its statement to the press following the announcement contained one important difference to recent policy statements.
Associated Press:
“… the Fed removed a reference to being “patient” about adjusting rates. That suggested that the Fed is now inclined to begin cutting rates for the first time in more than a decade.”
And with that, the dollar sold off.
That’s because if the Fed’s about to lower US interest rates, it makes the dollar less attractive to international capital seeking yield.
So, traders take ‘short’ dollar positions, where they aim to profit as the greenback falls.
It’s early days yet.
As you can see from the chart, although the dollar broke the trendline, it then bounced back to it.
Anyone familiar with technical analysis or charting will know that is what often happens after the break of a significant support line.
After the initial break, traders bid the price back up so that it touches and sometimes even breaks back above the trendline.
It’s a way of testing whether the breakdown was for real.
Remember, that trendline has acted as support for the dollar for more than a year.
Each time the price has dipped to the trendline, it has bounced.
So, now that it’s broken below it, a bunch of traders think that makes the dollar good value and are buying.
Meanwhile, there will be anther bunch of traders betting on the dollar falling. And now that it’s made that significant breakdown through support, they have good reason.
Time will tell whether there is further dollar weakness to come… or whether it was a false breakdown.
Meanwhile, as the dollar has been under pressure, commodity prices have soared in dollar terms.
Take gold as an example.
Here’s a five-year chart of gold priced in dollars.
The price has been contained by strong resistance at the $1,360-70 area for the past six years.
That is, until 20th June when it broke through and surged higher.
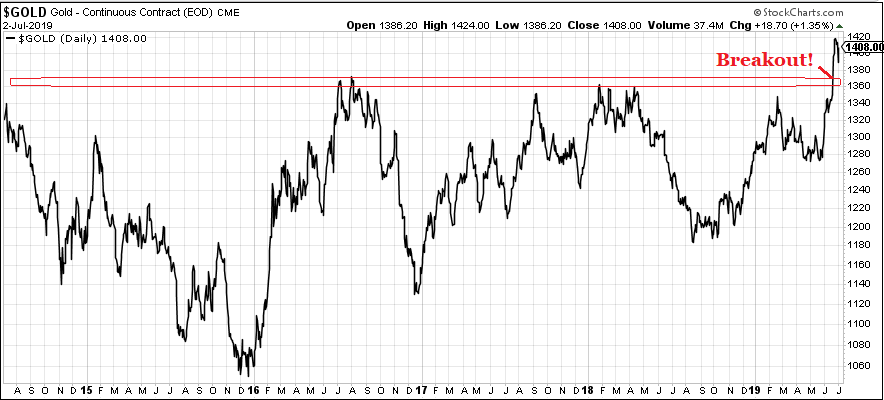
In fact, gold had been moving up before that, as tension between Iran and the US grew.
But it was the news of the Fed’s intention to cut rates that sparked the break to six-year highs.
As the dollar fell, gold rose.
And it’s been the same for the oil price, also priced in dollars.
Again, oil had been moving higher following Iran’s attacks on tankers in the Gulf of Oman.
But it was the Fed’s likely rate cut news that really sent it flying.
From $62 a barrel the day before the Fed, Brent crude moved as high as $66 over the following week.
Since then, the price has pulled back to around $63.
Oil is tricky to value right now from a fundamental viewpoint.
On the one hand, there is the outlook for a slowing global economy – the reason the Fed is planning to cut rates.
If economic growth slows, it will dampen demand for oil. That has caused the price to fall over the past couple of months.
On the other hand, OPEC countries such as Russia and Saudi Arabia are curbing production. That restriction on supply is supportive for the price.
At the same time, we have the ongoing tension in the Middle East which is also seen as threatening supply. Again, that’s also positive for the oil price.
What will be interesting is whether there really is an end in sight for the trade war between the US and China.
Following the G20 summit over the past week, there is hope talks will resume.
If that leads to positive resolution, oil should rally. But if Presidents Trump and Xi Jinping cannot reach an agreement and hostilities resume, oil could well fall.
With so much going on, it’s tough to make a call about where oil is heading in the medium to long term.
But that’s not to say there isn’t money to be made by trading it on a short-term basis.
And for that, it’s better to base your analysis on the price charts.
The Fed’s announcement on rates may have sparked the move higher in Brent crude oil on 20th June.
But our chart indicator pointed to a more sustained move to come. You can see it on the chart below. The green circle was the signal to BUY oil.
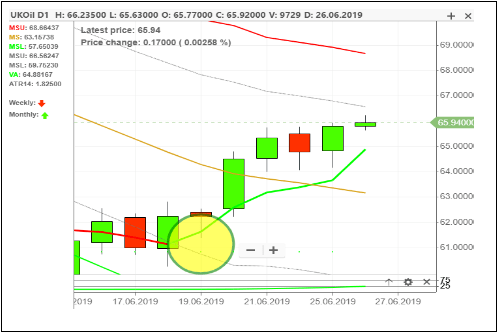
And as you can see, the price of oil moved higher, allowing our members to cash in on a 290-point gain in a few days. Based on trading at £3 per point, that’s enough to bank an £870 profit on one trade.
If you’d like to see exactly how to identify trades like this, please join us online for a live one-hour session.
Click here to claim your free place and select your preferred session time.