Ryanair recently announced a recruitment drive for cabin crew for its UK bases
Ryanair, the budget UK airline, released figures for its flight traffic on Wednesday, proving that travellers leapt at the opportunity to go abroad in July as restrictions on travel eased.
9.3m passengers took Ryanair flights during July, more than double the 4.4m figure from June.
Ryanair operated over 61,000 flights in July with an 80% “load factor”, meaning 80% of the available seats were filled. This showed that the airline considered flying to be safer than in June, when the “load factor” was 72%.
The pandemic battered the airline industry, and specifically Ryanair, as the company lost around £900m.
The company made a net loss of €273m for Q1 ending in June, although it has said it could make a profit in Q2, and break even over the course of the year.
Ryanair recently announced a recruitment drive for cabin crew for its UK bases as the airline recovers from the Covid-19 pandemic.
The airline has renewed its partnership with Crewlink, a company which specialises in the recruitment and training of cabin crew.
The Ryanair share price is up by 0.12% during the morning session on Wednesday.
Taylor Wimpey (LON:TW), the homebuilder, has constructed a record number of homes over the past half-year, boosting the company’s revenue levels in the process.
Over the last six months the FTSE 100 company completed 7,303 homes, a substantial increase from 2,771 during the same period a year ago.
The additional 4,500 properties saw its revenue surge by 191.1% to £2.1bn.
Taylor Wimpey also confirmed it raised its full-year profit guidance as the average selling price rose by 7%.
The firm’s new expectation is that its operating profit for 2021 will exceed £820m, which exceeds the top end of its previous estimates.
The FTSE 100 company is expecting between 13,200 and 14,000 new house completions.
Taylor Wimpey’s construction levels were impacted last year by pandemic-induced restrictions causing supply chain issues across the world.
Laura Hoy, Equity Analyst at Hargreaves Lansdown. commented on Taylor Wimpey’s results and the wider housing market:
“Another set of strong results from the UK’s housebuilders adds to mounting evidence that the pandemic has been a tailwind for the housing market. Turns out being locked inside for months on end has caused many people to re-evaluate their current living situation. Add to that the rising popularity of working from home, and you have the perfect excuse to move house.”
“Over the past few months, there’ve been mutterings of a potential slowdown in the UK’s red-hot housing market—Halifax reported a small decline in house prices in June—but from Taylor Wimpey’s perspective things are still ticking over nicely. The group reported a double-digit rise in house prices, a strong forward order book, and cancelation rates in line with 2019 levels.”
“If things carry on like this, Taylor Wimpey could be one of the pandemic’s biggest winners. The group was bolder than some of its peers with an aggressive land buying strategy that will pay off if the market remains buoyant. Of course, the group will suffer if the economy stumbles in the wake of the pandemic, but so far the group is building from a strong base.”
Swedish investor Peter Gyllenhammar is building up a stake in First Property (LON: FPO), which was hit by a sharp share price decline following its full year results. There is upside for the property manager and investor, though, because of its strong balance sheet and recurring income.
Peter Gyllenhammar is predominantly a value investor so he must see value in First Property, which manages property funds and owns property directly in the UK, Poland and Romania. On 28 July, his shareholding passed 3% and the stake has been increased to 4.07%.
The share price fell to 26.5p during 26 June and i...
Senior officials at the Federal Reserve suggested that it could start to reign in its support for the economy by October if non-farm payroll figures increase, as expected, by between 800,000 and 1m.
“If they come in as strong as the last one, then I think you have made the progress you need,” the Federal Reserve Governor Christopher Waller told CNBC. “If they don’t, then I think you are probably going to have to push things back a couple of months.”
Analysts are expecting the yellow metal to move sideways throughout the week ahead of the announcement of employment figures.
Gold’s underwhelming performance is a reflection of other markets, as the US dollar remains weak, while bond yields are low.
“A larger allocation into gold from investors is unlikely to materialize unless growth assumptions continue to deteriorate, thereby reducing the risk of central bank action,” said Ole Hansen, head of commodity strategy at Saxo Bank to Kitco.
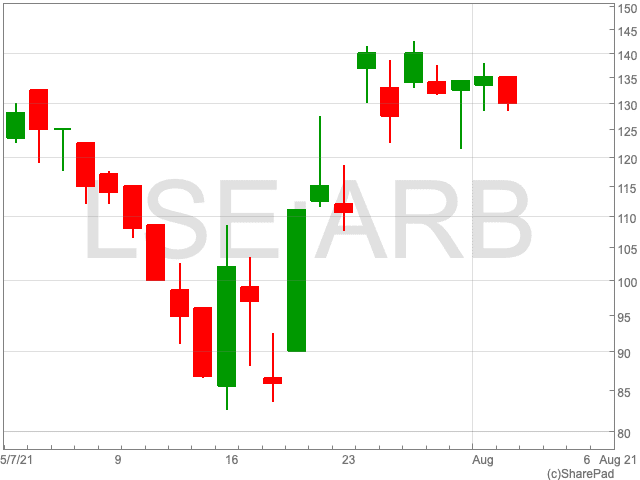
The Argo Blockchain share price(LON:ARB) is down by 3.47% on Tuesday as the bitcoin miner provided an operational update for July. Over the past five days of trading, the Argo Blockchain share price is hovering around the 130p level. It remains some way off its all-time-high of 284p reached in February. July was a busy month for both Argo and bitcoin, culminating in a renewed sense of optimism in the crypto market following the crash.
Operational Update
Argo’s mining output was up substantially in July to 225 bitcoin, compared to 167 the month before. It brings the company’s total bitcoin mined since the beginning of the year to 1108 bitcoin.
Based on daily foreign exchange rates and cryptocurrency prices during the month, mining revenue in July amounted to £5.6n ($7.79m), up from $6.05m the month before.
Argo Blockchain now owns 1,496 bitcoin as of the end of July.
Peter Wall, Chief Executive of Argo said: “I’m delighted that we have been able to capitalize on the reduction in global hash rate and mining difficulty this month to deliver these results at an impressive margin. We are also pleased to have broken ground at the Texas facility, and are excited about the opportunities that this development offers in allowing us to exercise greater control over our mining operations, to continue to utilize renewable power and to work with the local community in Texas to enact positive change.”
Bitcoin
As the bitcoin price pulled back over the last few days, investors will be curious over the direction of the cryptocurrency, and its impact on the Argo Blockchain share price.
At the time of writing, bitcoin is at £27,735, having been above £30,500 over the weekend.
Mark Warner, head of trading at BCB Group, gave Forbes his take, which will be well received by those with an eye on the Argo Blockchain share price.
“There are many sellers at $42,000, where longs have been trapped since 19 May, so we expect more resistance at this level. A confirmation of the breakout, by BTC retesting $34,500-$36,000, could provide buying opportunities for those who missed out.”
European stocks are currently best positioned to outperform the global equity market. That is the view of professional investors, ranging from pension, investment and hedge funds, according to data from Best Block and a Citigroup survey.
For years, US securities have been known to outperform broad indices, however, there may well be a changing of the guard.
It is only a new phenomenon. As recently as this spring, professional investors were of the view that US stocks offered the maximum possible returns.
However, Europe offers more investment opportunities in value stocks and cyclical investments, as well as assets that stand to benefit the most from a global economic recovery. In addition, European equities are also less vulnerable to concerns about inflation.
A survey among professional investors revealed that European shares were the most appealing investment, over raw materials and US equities.
Professional investors are not the only source suggesting an optimistic outlook for European shares. Google search engine data revealed a disproportionate weighting towards “European stocks” over “US stocks” too. The former received a Google Trend Score of 59, while “US stocks” scored just six, with 100 representing the highest possible search volume.
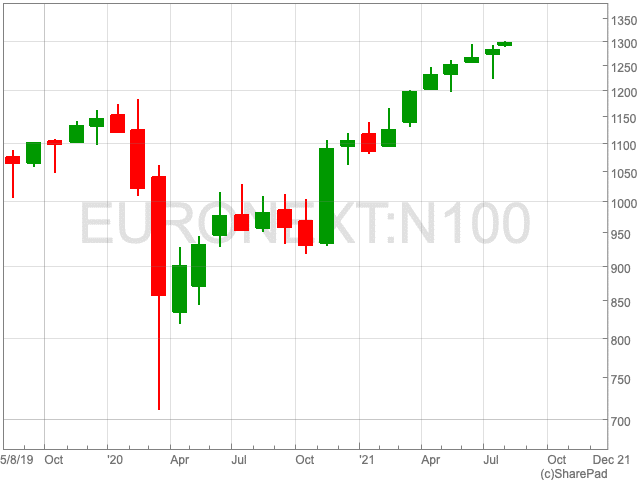
Having said that, US shares performed better last year. The NASDAQ gained 40.9% in a 365-day review, while the Dow Jones rose by 32.2%. By way of comparison, the EURONEXT 100 gained 29.1 %. That said, the tide could soon turn, according to the stock market experts.
The Euronext 100 Index, below, is the blue chip index of the pan-European exchange, Euronext NV. It comprises the largest and most liquid stocks traded on Euronext.
EU indices are leading the race when it comes to ESG credentials – although the leading indices from Germany, France and Italy still have much room for improvement, they are clearly ahead of major indices from the other G7 countries in terms of their temperature paths.
Major banks each have Price-to-Book ratio below one
Standard Chartered bank (LON:STAN) has reported a larger-than-expected increase in profits in the first half of the year, resumed interim dividend payments and confirmed a $250 million share buyback.
Thanks to an improvement in bad loans and the recovery from the coronavirus pandemic, Standard Chartered saw its H1 pre-tax profits rise by 57% to $2.56bn.
Analysts had made initial forecasts of $2.23bn.
Standard Chartered’s results confirm the trends shown over the past week by Barclays, Lloyds, NatWest and HSBC.
This is despite the in geographic and business mixes between the big five FTSE 100 lenders, says AJ Bell Investment Director Russ Mould.
However, the markets are not reflecting the seemingly bright outlook painted by the recent run of results.
“Investors are clearly unconvinced that the banks are out of the woods, as the shares of all five trade well below their official, stated net asset – or book – value per share,” Mould said.
This suggests that markets are either unsure on the banks’ ability to generate sustainable double-digit returns on equity, or they think the net asset values are too optimistic. Otherwise, it would mean the banks are very undervalued.
Standard Chartered has the lowest Price-to-Book ratio at 0.47, while Lloyds, at 0.83, has the highest.
The Price-to-Book ratio is calculated by dividing the company’s stock price per share by its book value per share.
A price to book ratio of less than one suggests that the market is valuing the company at less than the total value of its assets.
2021E
Q2 2021
2021E
2021E
P/E
Price/book
Dividend yield
Dividend cover
Standard Chartered
9.3 x
0.47 x
3.2%
3.32 x
Barclays
6.8 x
0.63 x
3.2%
4.53 x
HBSC
12.4 x
0.71 x
4.1%
1.95 x
NatWest Group
14.6 x
0.77 x
4.9%
1.40 x
Lloyds
7.7 x
0.83 x
3.8%
3.43 x
Standard Chartered’s profits were up sharply – thanks in the main to lower loan impairments or even their reversal – while net interest margins showed signs of stabilisation and loan growth showed some encouraging signs of momentum. Standard Chartered also declared an interim dividend and a second share buyback scheme.
“Similar trends were evident at Barclays, Lloyds, NatWest and HSBC, as all drew some benefit from the post-lockdown economic upturn, a return to some degree of consumer and business confidence and the absence of any fresh interest rate cuts from central banks,” said Mould.
Trident welcomes Paul Smith to the board as Non-Executive Chair
Trident Royalties (LON:TRR) released its Q2 operating results on Tuesday, bringing attention to a number of projects in which it has royalties.
In addition to asset level progress, the second quarter saw significant board changes and the strengthening of Trident Royalties’ balance sheet.
Trident’s asset level progress at a number of projects over which it holds royalties includes its commencement of pre-stripping of a new deposit in the royalty zone at Koolyanobbing.
The diversified mining royalty and streaming company outlined a 50% increase in indicated resources at the Lake Rebecca Gold Project with total resources now in excess of 1.1Moz.
Trident continued construction activities at the Warrawoona Gold Project, while there were positive indications for the forthcoming Feasibility Study for the Thacker Pass Lithium Project.
Finally, Trident confirmed a successful $73m equity fundraise to fast track the development of a standalone processing operation at the Mimbula Copper Project.
Trident welcomed Paul Smith to the board as Non-Executive Chair, coupled with a placement to Mr Smith of £1m at 40p per share. Mr Smith worked for Glencore Plc from 2011 until 2020, most recently as Head of Strategy with a focus on capital markets, mergers and acquisitions and capital allocation.
Second-quarter royalty payments amounted to US$381,808 from royalties over producing assets, namely Mimbula and Koolyanobbing.
Adam Davidson, Chief Executive Officer of Trident commented:
“Trident continues to make strong progress towards building the critical mass required to realise our strategy to offer investors an increasing source of revenue through a diversified portfolio of mining royalties.”
“This diversification is perhaps the key differentiator for Trident, as we look to broadly mirror the commodity exposure of the global mining sector, providing access not only to precious metals, but also base metals, bulk commodities and battery/technology metals.”
The FTSE 100 rose 0.35% to 7,106 on Tuesday morning, led by BP swinging back into profit for its half year.
“While there was the long-awaited news of a share buyback, confirmed at $1.4 billion, some investors may be disappointed at the paltry rise in the dividend. BP nudged up the shareholder payout by 4%, which pales in comparison to Royal Dutch Shell’s 40% increase declared last month,” said Russ Mould, investment director at AJ Bell.
The major market news of the day so far, however, comes from China. Fears of regulatory interference from the Chinese government aren’t going anywhere, as Tencent becomes the latest stock to fall.
“Talk that gaming will be the next sector to come under pressure from the authorities in China saw Tencent’s shares fall more than 10% at one point on Tuesday. They are now down by more than a fifth year to date as investors reassess their willingness to have exposure to big Chinese names,” according to Russ Mould.
“This is turning out to be one of the big stories of 2021 for global markets, overshadowing what many people thought would the key focal point for Asia – namely a year of strong economic growth.”
FTSE 100 Top Movers
BP (3.55%), Fresnillo (2.89%) and Sainsbury (1.91%) are the three top risers on the FTSE 100 so far today.
At the other end, Smiths Group (-7.73%), Melrose Industries (-2.61%) and Weir Group (-2.09%) make up the bottom three on the UK index.
BP
BP raised its dividend and committed to buying back shares after its Q2 profit surpassed expectations as oil prices rose and demand recovered.
BP will give shareholders $1.4bn (£1bn) through share buybacks, while it will increase its dividend by 4% a year up to 2025.
BP made an underlying profit of $2.8bn for the quarter to June, a sharp increase from a loss of $6.68bn year-on-year, as the pandemic brought the oil industry to its knees.
With the COVID-19 pandemic accelerating the shift towards a digital-first world; technology stocks rose to all-time highs in 2020, as people spent more time online.1 However, as economies have begun to reopen following the rollout of highly effective coronavirus vaccines; tech stocks sold-off as investors rotated towards sectors set to benefit from reopening. In this article, we discuss the recent volatility in the tech space – highlighting recent performance, valuations and outlook for the sector.
Until relatively recently, one would have been forgiven for believing that technology stocks were unstoppable. The extraordinary events of 2020 may have taught us many things, but they also reinforced the fact that we struggle to function without the inter-connectivity that the world’s big tech businesses provide. Whilst the pandemic has had a profoundly detrimental effect on many businesses, with those in the leisure, travel or retail sectors seeing revenues collapse,technology companies have been the winners, securing online sales at the expense of their ‘bricks and mortar’ counterparts and connecting people in isolation through their software.
Many of the nascent trends of recent years towards remote working, streaming and digitalisation have accelerated markedly through the lockdown, driving sales relentlessly higher for the tech sector. Its investors were – again – rewarded handsomely: the tech-heavy NASDAQ Composite was up over 40% for the year, whilst the ‘FAANG’ powerhouse of five – Facebook, Apple, Amazon, Netflix and Google (now known as Alphabet) – were up an average of over 55%. Shareholders in Microsoft – by market cap, the world’s largest technology business – saw the stock price climb by almost 40%.2 In tandem, an emerging group of younger, innovative and irrepressible leaders – from cloud-based service providers and fintech players to e-commerce enablers – have also shown impressive growth, their progress fuelled by rapid societal changes catalysed by the pandemic.
Hot stocks can cool down, however. With the ‘re-opening trade’ dominating the market, and positive vaccine data focusing attention less on growth stocks and more on cyclicals – and those that have been beaten down by COVID-19 but are now emerging from hibernation – recent months have seen a marked slowdown in the tech space. The NASDAQ in mid-May was some 7% off the two historic highs it achieved earlier in the year in mid-February and the end of April. It’s up less than 10% over the last six months and trails the broader S&P 500, which is up over 13%.3This has prompted some to question whether the lull is transient or more structural, with valuations seemingly stretched. In September of last year, Apple became the first company to exceed a market capitalisation of $2 trillion, surpassing the entire value of the UK’s FTSE 100 Index.Moreover, the sector faces some headwinds with regulators concerned by the dominant market share of the larger technology businesses, their at times aggressive plans for growth, and the privacy of data. More recently, the prospects of higher interest rates should inflation run hotter than expected and proposed tax reform from G7 countries have also caught investors’ attention.
It’s worth noting, of course, that the vernacular use of the term ‘tech sector’ requires closer examination: whilst Apple and Microsoft are encompassed by the official tech sector classification, Facebook and Alphabet sit within the ‘communications services’ sector whilst Amazon inhabits the ‘consumer discretionary’ sector. Despite technological innovation being the unifying force which drove the meteoric success of these businesses, they have no simple, collective gathering place and any analysis of their performance and prospects requires a nuanced approach.
Overpriced? Maybe not
With the likes of Netflix and Amazon down 16% and 5% respectively since their 2020 share price highs4, the fundamental question is: does the undeniable weakness in tech stocks suggest they are overpriced and, therefore, may correct further?
A closer look at the data proves to be revealing. Whilst their share prices have underperformed over the last few months, the consensus earnings estimates for the ‘big growth’ tech brands have climbed noticeably since last August 2020, such that their price earnings ratios have been dropping, as illustrated by the examples in the table below.
Consensus earnings estimates for 2021 & P/E ratios – change since 01.09.205
Earnings per share
Price/earnings (P/E) ratio
Alphabet
+54%
-10%
Apple
+34%
-27%
Facebook
+29%
-17%
Microsoft
+20%
-11%
Median
+31.5%
-14.0%
It would seem that, at least on the fundamental P/E measure, these tech goliaths are not as overpriced as one might have imagined. Anticipated profits for the four businesses have grown 31% on average since the beginning of September 2020 whilst their P/E has fallen 14%. Interestingly, the median share price increase was 7% versus the S&P 500’s 18% climb.5
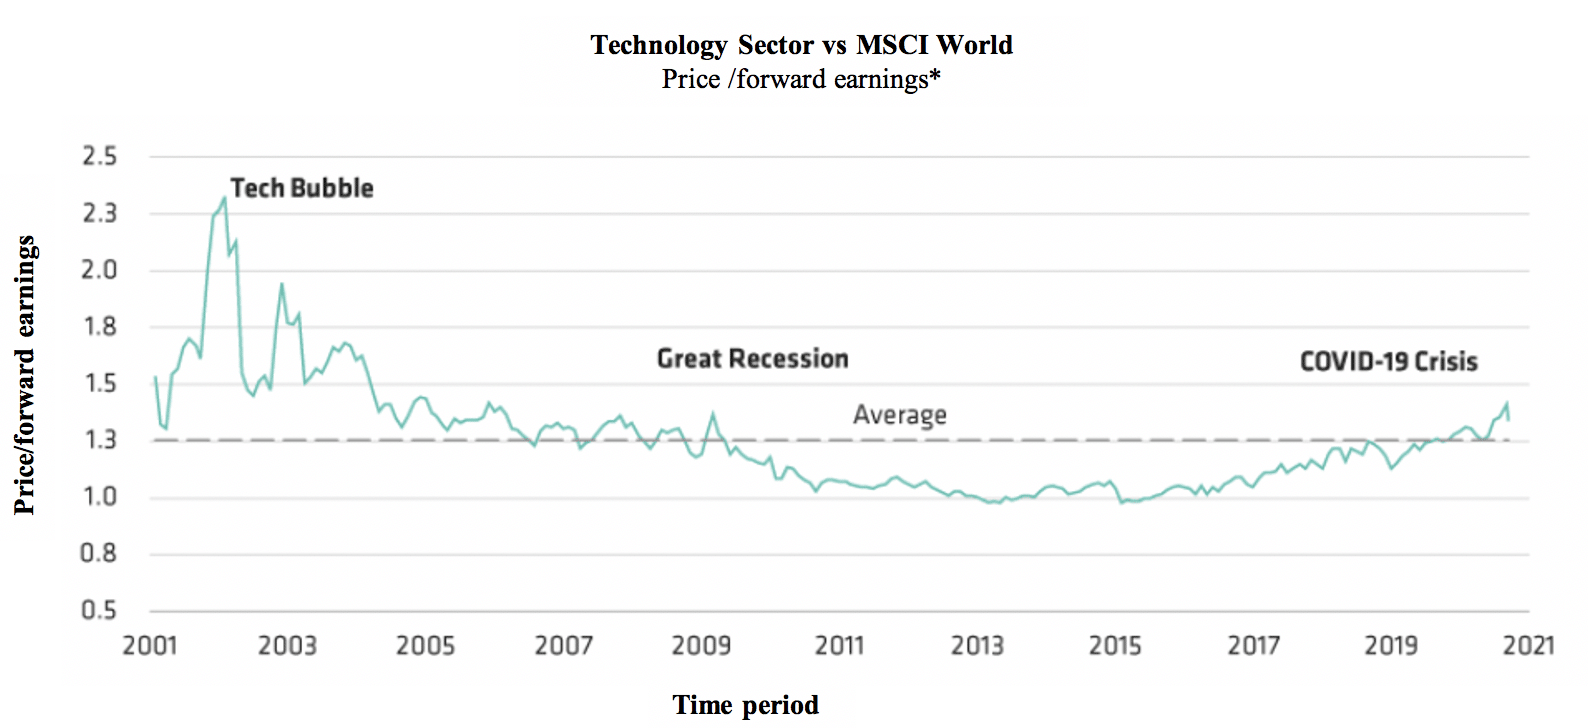
Further insights emerge by taking a longer-term retrospective. Despite recent volatility, the sector’s valuation premium – on a price/forward earnings basis – relative to the MSCI World Index, at circa 1.3x, is still broadly in line with its historical average, having been north of 2.3 during the tech bubble, as shown in the table below.6
Through September 11, 2020
*Based on estimated earnings for the next 12 months
Source: Factset, MSCI World Index and AllianceBernstein (AB),
Does high valuation equate to high risk?
Paying more for a stock isn’t intrinsically riskier, particularly when one takes into account the fact that the underlying drivers of an elevated valuation may be many and varied. Tech companies subject to secular growth drivers are perceived to have more predictable earnings growth than those with cyclical drivers. Those with cyclical drivers have a greater dependence on macro-economic forces adversely affected by the pandemic and are therefore deemed to be much riskier. As recent earnings seasons have shown, tech businesses are among the very few in a position to report year-on-year revenue and earnings growth. Innovative tech companies may appear overvalued if viewed only on the basis of consensus estimates at a fixed point in time and, therefore, it may simply be that valuations are the wrong debate, leading to an unhelpfully heavy focus on price rather than on the potential for earnings growth.
An obvious, but seminal, example is Amazon. What began as a conventional, e-commerce bookseller has transformed itself into a technology powerhouse that now embraces retail, advertising, entertainment media, logistics and cloud-based services. Tellingly, throughout this metamorphosis, the market consistently underestimated the business’s growth potential and its powers of endurance by under-appreciating its earnings trajectory. Technology, as a sector, is difficult to avoid of course. Invest in the S&P 500 and over a quarter of your holdings will be in the information technology sector, the top five stocks by weight being Apple, Microsoft, Amazon, Facebook, and Alphabet.6If you favour a more global approach, you’ll see that over 60% of the FTSE World Index is invested in the US, and those top five holdings are exactly the same, making up over 12% of the index by weight.7
Yesterday’s growth, tomorrow’s value?
The Bankers Investment Trust– managed by Alex Crooke and part of the Janus Henderson managed investment trust stable – adopts a measured approach to the sector. The trust has the flexibility to invest in any geographic region and any sector (it’s a member of the Association of Investment Companies’ Global sector) with no set limits on individual country or sector exposure and, therefore, the make-up of the portfolio generally differs materially from its FTSE World Index benchmark. Currently, its North American weighting (dominated by the US) is circa 34% and, whilst its exposure to the technology sector is circa 17%, only one of the “major tech” businesses – Microsoft – appears in the top 10 holdings.8
In Alex’s view, we are experiencing a change in market leadership, with growth names, particularly FAANG stocks beginning to lose their leadership. In the low-growth world of recent years, the growth offered by tech businesses – and fuelled by the pandemic tailwind – has been significant, and clearly reflected in prices. He is keen to point out that more time spent online during 2020 has proved to be a metaphorical shot in the arm for technology businesses, but with actual shots now heavily insulating people from the effects of the coronavirus, companies with more to gain from economic ‘re-opening’ are increasingly favoured, with the tech sector experiencing its fair share of volatility in recent months. Nevertheless, there are solid reasons for the sector’s continuing appeal, although the blind optimism that fuelled the last tech boom in the 90s is noticeably absent.
There can be little doubt that the tech and communications service sectors will, in all probability, grow earnings at a faster pace than, say, airlines, industrials and large banks over the long term. Moreover, it’s probable that only government intervention to break up these companies will derail their domination of certain segments of the economy. Despite that, the impressive Q1 results delivered by a host of those tech stocks have done little to catalyse much in the way of investor enthusiasm, and it is exactly this form of market apathy that sometimes presents opportunities.
An approach some technology businesses may well contemplate is to begin returning cash to shareholders through the payment of dividends, as Microsoft and Apple currently do.
Who knows … could it be that the tech titans become the new income stocks of 2021?
The term “brick-and-mortar” refers to a traditional street-side business that offers products and services to its customers face-to-face in an office or store that the business owns or rents. The local grocery store and the corner bank are examples of brick-and-mortar companies.
Cyclical
A cyclical stock is a stock that’s price is affected by macroeconomic or systematic changes in the overall economy. Cyclical stocks are known for following the cycles of an economy through expansion, peak, recession, and recovery. Cyclical stocks are the opposite of defensive stocks.
Earnings per share (EPS)
The portion of a company’s profit attributable to each share in the company. It is one of the most popular ways for investors to assess a company’s profitability.
Forward price-to-earnings (forward P/E)
Forward price-to-earnings (forward P/E) is a version of the ratio of price-to-earnings (P/E) that uses forecasted earnings for the P/E calculation.
Growth stock
A growth stock is any share in a company that is anticipated to grow at a rate significantly above the average growth for the market.
Inflation
The rate at which the prices of goods and services are rising in an economy. The CPI and RPI are two common measures. The opposite of deflation.
Market Capitalization
Market capitalization refers to the total dollar market value of a company’s outstanding shares of stock. Commonly referred to as “market cap,” it is calculated by multiplying the total number of a company’s outstanding shares by the current market price of one share.
Macro-economic
Macroeconomics is a branch of economics that studies how an overall economy—the market or other systems that operate on a large scale—behaves. Macroeconomics studies economy-wide phenomena such as inflation, price levels, rate of economic growth, national income, gross domestic product (GDP), and changes in unemployment.
Price-to-earnings (P/E) ratio
A popular ratio used to value a company’s shares. It is calculated by dividing the current share price by its earnings per share. In general, a high P/E ratio indicates that investors expect strong earnings growth in the future, although a (temporary) collapse in earnings can also lead to a high P/E ratio.
Valuation metrics
Metrics used to gauge a company’s performance, financial health and expectations for future earnings e.g., price to earnings (P/E) ratio and return on equity (ROE).
Valuation premium
A valuation premium refers to the excess in value that a buyer estimates for a company compared to its peers in the same industry.
Volatility
The rate and extent at which the price of a portfolio, security or index, moves up and down. If the price swings up and down with large movements, it has high volatility. If the price moves more slowly and to a lesser extent, it has lower volatility. It is used as a measure of the riskiness of an investment.
Before investing in an investment trust referred to in this document, you should satisfy yourself as to its suitability and the risks involved, you may wish to consult a financial adviser. Past performance is not a guide to future performance. The value of an investment and the income from it can fall as well as rise and you may not get back the amount originally invested. Tax assumptions and reliefs depend upon an investor’s particular circumstances and may change if those circumstances or the law change. Nothing in this document is intended to or should be construed as advice. This document is not a recommendation to sell or purchase any investment. It does not form part of any contract for the sale or purchase of any investment. [We may record telephone calls for our mutual protection, to improve customer service and for regulatory record keeping purposes.]