Synopsis
With the COVID-19 pandemic accelerating the shift towards a digital-first world; technology stocks rose to all-time highs in 2020, as people spent more time online.1 However, as economies have begun to reopen following the rollout of highly effective coronavirus vaccines; tech stocks sold-off as investors rotated towards sectors set to benefit from reopening. In this article, we discuss the recent volatility in the tech space – highlighting recent performance, valuations and outlook for the sector.
Until relatively recently, one would have been forgiven for believing that technology stocks were unstoppable. The extraordinary events of 2020 may have taught us many things, but they also reinforced the fact that we struggle to function without the inter-connectivity that the world’s big tech businesses provide. Whilst the pandemic has had a profoundly detrimental effect on many businesses, with those in the leisure, travel or retail sectors seeing revenues collapse,technology companies have been the winners, securing online sales at the expense of their ‘bricks and mortar’ counterparts and connecting people in isolation through their software.
Many of the nascent trends of recent years towards remote working, streaming and digitalisation have accelerated markedly through the lockdown, driving sales relentlessly higher for the tech sector. Its investors were – again – rewarded handsomely: the tech-heavy NASDAQ Composite was up over 40% for the year, whilst the ‘FAANG’ powerhouse of five – Facebook, Apple, Amazon, Netflix and Google (now known as Alphabet) – were up an average of over 55%. Shareholders in Microsoft – by market cap, the world’s largest technology business – saw the stock price climb by almost 40%.2 In tandem, an emerging group of younger, innovative and irrepressible leaders – from cloud-based service providers and fintech players to e-commerce enablers – have also shown impressive growth, their progress fuelled by rapid societal changes catalysed by the pandemic.
Read more about our latest insights
Hot stocks can cool down, however. With the ‘re-opening trade’ dominating the market, and positive vaccine data focusing attention less on growth stocks and more on cyclicals – and those that have been beaten down by COVID-19 but are now emerging from hibernation – recent months have seen a marked slowdown in the tech space. The NASDAQ in mid-May was some 7% off the two historic highs it achieved earlier in the year in mid-February and the end of April. It’s up less than 10% over the last six months and trails the broader S&P 500, which is up over 13%.3This has prompted some to question whether the lull is transient or more structural, with valuations seemingly stretched. In September of last year, Apple became the first company to exceed a market capitalisation of $2 trillion, surpassing the entire value of the UK’s FTSE 100 Index.Moreover, the sector faces some headwinds with regulators concerned by the dominant market share of the larger technology businesses, their at times aggressive plans for growth, and the privacy of data. More recently, the prospects of higher interest rates should inflation run hotter than expected and proposed tax reform from G7 countries have also caught investors’ attention.
It’s worth noting, of course, that the vernacular use of the term ‘tech sector’ requires closer examination: whilst Apple and Microsoft are encompassed by the official tech sector classification, Facebook and Alphabet sit within the ‘communications services’ sector whilst Amazon inhabits the ‘consumer discretionary’ sector. Despite technological innovation being the unifying force which drove the meteoric success of these businesses, they have no simple, collective gathering place and any analysis of their performance and prospects requires a nuanced approach.
Overpriced? Maybe not
With the likes of Netflix and Amazon down 16% and 5% respectively since their 2020 share price highs4, the fundamental question is: does the undeniable weakness in tech stocks suggest they are overpriced and, therefore, may correct further?
A closer look at the data proves to be revealing. Whilst their share prices have underperformed over the last few months, the consensus earnings estimates for the ‘big growth’ tech brands have climbed noticeably since last August 2020, such that their price earnings ratios have been dropping, as illustrated by the examples in the table below.
Consensus earnings estimates for 2021 & P/E ratios – change since 01.09.205
| Earnings per share | Price/earnings (P/E) ratio | |
| Alphabet | +54% | -10% |
| Apple | +34% | -27% |
| +29% | -17% | |
| Microsoft | +20% | -11% |
| Median | +31.5% | -14.0% |
It would seem that, at least on the fundamental P/E measure, these tech goliaths are not as overpriced as one might have imagined. Anticipated profits for the four businesses have grown 31% on average since the beginning of September 2020 whilst their P/E has fallen 14%. Interestingly, the median share price increase was 7% versus the S&P 500’s 18% climb.5
Further insights emerge by taking a longer-term retrospective. Despite recent volatility, the sector’s valuation premium – on a price/forward earnings basis – relative to the MSCI World Index, at circa 1.3x, is still broadly in line with its historical average, having been north of 2.3 during the tech bubble, as shown in the table below.6
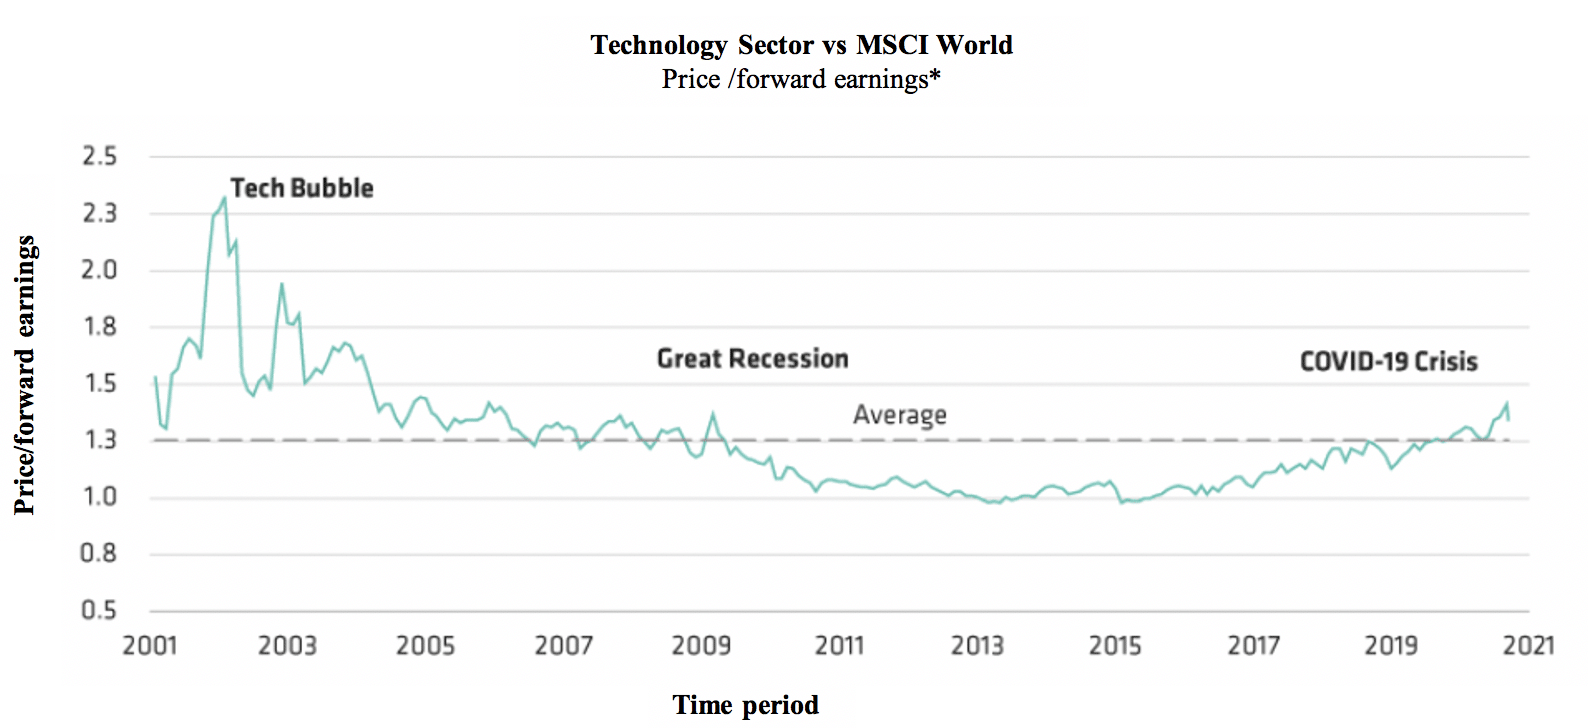
Through September 11, 2020
*Based on estimated earnings for the next 12 months
Source: Factset, MSCI World Index and AllianceBernstein (AB),
Does high valuation equate to high risk?
Paying more for a stock isn’t intrinsically riskier, particularly when one takes into account the fact that the underlying drivers of an elevated valuation may be many and varied. Tech companies subject to secular growth drivers are perceived to have more predictable earnings growth than those with cyclical drivers. Those with cyclical drivers have a greater dependence on macro-economic forces adversely affected by the pandemic and are therefore deemed to be much riskier. As recent earnings seasons have shown, tech businesses are among the very few in a position to report year-on-year revenue and earnings growth. Innovative tech companies may appear overvalued if viewed only on the basis of consensus estimates at a fixed point in time and, therefore, it may simply be that valuations are the wrong debate, leading to an unhelpfully heavy focus on price rather than on the potential for earnings growth.
Read more about our latest insights
An obvious, but seminal, example is Amazon. What began as a conventional, e-commerce bookseller has transformed itself into a technology powerhouse that now embraces retail, advertising, entertainment media, logistics and cloud-based services. Tellingly, throughout this metamorphosis, the market consistently underestimated the business’s growth potential and its powers of endurance by under-appreciating its earnings trajectory. Technology, as a sector, is difficult to avoid of course. Invest in the S&P 500 and over a quarter of your holdings will be in the information technology sector, the top five stocks by weight being Apple, Microsoft, Amazon, Facebook, and Alphabet.6If you favour a more global approach, you’ll see that over 60% of the FTSE World Index is invested in the US, and those top five holdings are exactly the same, making up over 12% of the index by weight.7
Yesterday’s growth, tomorrow’s value?
The Bankers Investment Trust– managed by Alex Crooke and part of the Janus Henderson managed investment trust stable – adopts a measured approach to the sector. The trust has the flexibility to invest in any geographic region and any sector (it’s a member of the Association of Investment Companies’ Global sector) with no set limits on individual country or sector exposure and, therefore, the make-up of the portfolio generally differs materially from its FTSE World Index benchmark. Currently, its North American weighting (dominated by the US) is circa 34% and, whilst its exposure to the technology sector is circa 17%, only one of the “major tech” businesses – Microsoft – appears in the top 10 holdings.8
In Alex’s view, we are experiencing a change in market leadership, with growth names, particularly FAANG stocks beginning to lose their leadership. In the low-growth world of recent years, the growth offered by tech businesses – and fuelled by the pandemic tailwind – has been significant, and clearly reflected in prices. He is keen to point out that more time spent online during 2020 has proved to be a metaphorical shot in the arm for technology businesses, but with actual shots now heavily insulating people from the effects of the coronavirus, companies with more to gain from economic ‘re-opening’ are increasingly favoured, with the tech sector experiencing its fair share of volatility in recent months. Nevertheless, there are solid reasons for the sector’s continuing appeal, although the blind optimism that fuelled the last tech boom in the 90s is noticeably absent.
There can be little doubt that the tech and communications service sectors will, in all probability, grow earnings at a faster pace than, say, airlines, industrials and large banks over the long term. Moreover, it’s probable that only government intervention to break up these companies will derail their domination of certain segments of the economy. Despite that, the impressive Q1 results delivered by a host of those tech stocks have done little to catalyse much in the way of investor enthusiasm, and it is exactly this form of market apathy that sometimes presents opportunities.
An approach some technology businesses may well contemplate is to begin returning cash to shareholders through the payment of dividends, as Microsoft and Apple currently do.
Who knows … could it be that the tech titans become the new income stocks of 2021?
1 Source: CNBC, 09.06.20 – Amazon, Apple, Facebook, Microsoft close all-time high: Big Tech rally (cnbc.com)
2Source: NASDAQ Composite Index, 01.01.20 to 31.12.20
3Source: Bloomberg: 31.12.20 to 11.06.21
4Source: Bloomberg: as at 11.06.21
5Source: CNBC, 01.09.20 to 20.05.21 – https://www.cnbc.com/2021/05/20/op-ed-this-is-what-investors-are-misunderstanding-about-tech-stocks.html
6Source: FactSet, to 11.09.20 – https://www.alliancebernstein.com/library/Debunking-the-Myths-of-High-Priced-Tech-Stocks.htm
7Source: S&P 500 Index factsheet, 28.05.21
8Source: FTSE World Index factsheet, 31.05.21
9Source: The Bankers Investment Trust PLC factsheet, 30.04.2
Bricks and Mortar
The term “brick-and-mortar” refers to a traditional street-side business that offers products and services to its customers face-to-face in an office or store that the business owns or rents. The local grocery store and the corner bank are examples of brick-and-mortar companies.
Cyclical
A cyclical stock is a stock that’s price is affected by macroeconomic or systematic changes in the overall economy. Cyclical stocks are known for following the cycles of an economy through expansion, peak, recession, and recovery. Cyclical stocks are the opposite of defensive stocks.
Earnings per share (EPS)
The portion of a company’s profit attributable to each share in the company. It is one of the most popular ways for investors to assess a company’s profitability.
Forward price-to-earnings (forward P/E)
Forward price-to-earnings (forward P/E) is a version of the ratio of price-to-earnings (P/E) that uses forecasted earnings for the P/E calculation.
Growth stock
A growth stock is any share in a company that is anticipated to grow at a rate significantly above the average growth for the market.
Inflation
The rate at which the prices of goods and services are rising in an economy. The CPI and RPI are two common measures. The opposite of deflation.
Market Capitalization
Market capitalization refers to the total dollar market value of a company’s outstanding shares of stock. Commonly referred to as “market cap,” it is calculated by multiplying the total number of a company’s outstanding shares by the current market price of one share.
Macro-economic
Macroeconomics is a branch of economics that studies how an overall economy—the market or other systems that operate on a large scale—behaves. Macroeconomics studies economy-wide phenomena such as inflation, price levels, rate of economic growth, national income, gross domestic product (GDP), and changes in unemployment.
Price-to-earnings (P/E) ratio
A popular ratio used to value a company’s shares. It is calculated by dividing the current share price by its earnings per share. In general, a high P/E ratio indicates that investors expect strong earnings growth in the future, although a (temporary) collapse in earnings can also lead to a high P/E ratio.
Valuation metrics
Metrics used to gauge a company’s performance, financial health and expectations for future earnings e.g., price to earnings (P/E) ratio and return on equity (ROE).
Valuation premium
A valuation premium refers to the excess in value that a buyer estimates for a company compared to its peers in the same industry.
Volatility
The rate and extent at which the price of a portfolio, security or index, moves up and down. If the price swings up and down with large movements, it has high volatility. If the price moves more slowly and to a lesser extent, it has lower volatility. It is used as a measure of the riskiness of an investment.
Read more about our latest insights
| Before investing in an investment trust referred to in this document, you should satisfy yourself as to its suitability and the risks involved, you may wish to consult a financial adviser. Past performance is not a guide to future performance. The value of an investment and the income from it can fall as well as rise and you may not get back the amount originally invested. Tax assumptions and reliefs depend upon an investor’s particular circumstances and may change if those circumstances or the law change. Nothing in this document is intended to or should be construed as advice. This document is not a recommendation to sell or purchase any investment. It does not form part of any contract for the sale or purchase of any investment. [We may record telephone calls for our mutual protection, to improve customer service and for regulatory record keeping purposes.] Issued in the UK by Janus Henderson Investors. Janus Henderson Investors is the name under which investment products and services are provided by Janus Capital International Limited (reg no. 3594615), Henderson Global Investors Limited (reg. no. 906355), Henderson Investment Funds Limited (reg. no. 2678531), Henderson Equity Partners Limited (reg. no.2606646), (each registered in England and Wales at 201 Bishopsgate, London EC2M 3AE and regulated by the Financial Conduct Authority) and Henderson Management S.A. (reg no. B22848 at 2 Rue de Bitbourg, L-1273, Luxembourg and regulated by the Commission de Surveillance du Secteur Financier). [Janus Henderson, Janus, Henderson, Perkins, Intech, VelocityShares, Knowledge Shared, Knowledge. Shared and Knowledge Labs] are trademarks of Janus Henderson Group plc or one of its subsidiaries. © Janus Henderson Group plc. |