Today’s results from Vimto maker Nichols (LON: NICL) are in stark contrast to yesterday’s trading statement from IRN-BRU maker AG Barr (LON: BAG) (see https://ukinvestormagazine.co.uk/irn-bru-maker-ag-barr-goes-flat/).
AIM-quoted Nichols grew revenues by 10% to £71.6m in the six months to June 2019. However operating margins declined from 20.1% to 18.6%, so pre-tax profit edged up from £13.1m to £13.3m.
The interim dividend is being increased from 11.3p a share to 12.4p a share. There is £29.5m in the bank. This figure has fallen through a combination of acquisition spending and higher workin...
Turkey-based gold mining company Ariana Resources plc (LON: AUU) followed its update on its Salinbas Project with today’s update on the Company’s Kiziltepe Mine. Kiziltepe is part of the Red Rabbit joint venture with Proccea Construction Co. and is 50% owned by Ariana.
The Group posted a growth in total ore processed on a quarter-on-quarter basis, up from 46,825 tonnes in Q1 2019, to 48,132 tonnes for Q2 2019. The average head grade to the plant stood at 4.16 g/t of gold.
Quarterly open pit ore mined stood at c. 43,367 tonnes at a avg grade of 4.59 g/t gold. Total material movement stood at 943,034 tonnes and average metallurgical plant recovery of gold remained high at 95.2% for Q1.
However, gold production dipped from 7,296 ounces in Q1 to 6,438 ounces in Q2 2019.
Ariana Resources comments
Dr. Kerim Sener, Managing Director, commented:
“We are very pleased to report strong second quarter 2019 operational performance at Kiziltepe, including one of the highest material movement rates in the mine’s history. Gold production during the quarter was again above target, although operations continued to be constrained by the pushback underway on the southern wall of the pit. Careful stockpile management through the period enabled mill throughput to be maintained according to guidance. While a pattern of unusually wet weather has continued even into July, progress on pit development has been continuing at pace and material movements have increased further. These higher mining rates are being accommodated by an increase in fleet capacity by our mining contractor and this will be maintained as we progress with pre-stripping of the Arzu North and Derya pits later this summer.”
Speciality chemicals and sustainable technologies company Johnson Matthey PLC (LON: JMAT) reported stagnant sales and growth across its divisions for the first quarter, ahead of its AGM.
On a constant currency basis, sales remained flat on the whole. While their Clean Air sector saw growth driven by their European Light Duty business, this was offset by disappointing performance by Natural Resources and Health, while New Markets was described as ‘broadly flat’.
Johnson Matthey noted that performance was set to be weighted towards the second half, and that the Group’s full year guidance remained unchanged.
Despite flat sales, the Group booked £566 million in underlying profits.
“Another good year with strong sales and operating profit growth.” Our preliminary results for the year ended 31st March 2019 are out now – visit our website for the full picture. https://t.co/yIa99cakQx#JMresultspic.twitter.com/muwOOfD7pE
The Company’s outlook read as follows,
“Our group guidance, at constant rates, for the year ended 31 March 2020 remains unchanged. We expect growth in operating performance at constant rates to be within our medium term guidance of mid to high single digit growth.”
“By sector, Clean Air performance is now expected to be slightly below the prior year. This is expected to be compensated by better performance in Efficient Natural Resources driven by actions taken to improve efficiency, and other ongoing efficiencies across the group.”
Advanced materials group Versarien PLC (LON: VRS) followed up its graphene order update at the end of June with exciting operational developments and mixed financial results for the year ended 31 March 2019.
@versarien is pleased to announce its unaudited results for the year ended 31 March 2019. Click for more information…https://t.co/05IbfHmDQr
https://platform.twitter.com/widgets.js
In its operational update, the Company acquired energy storage tech company Gnanomat S.L. and commenced thirteen new graphene application collaborations and MOU agreements in the UK and overseas.
The Group also announced that the UK government continued to support the Company’s international expansion plans, including the recent establishment of its US subsidiary, Versarien Graphene Inc.
Versarien continued by noting that it had joined the Graphene Engineering Innovation Centre as a tier one member, giving it access to development and scale-up facilities worth c.£60 million.
Regarding financials, the Group’s revenues rose modestly during the full year, up to £9.14 million from £9.02 million for the FY18. Adjusted LBITDA was also up from £0.8 million to £1.1 million, net assets jumped 66% from £8.0 million to £13.3 million and the Company collected £5.2 million during its fundraising in September 2018.
Despite some positive results, the Group noted that loss before tax widened from £1.6 million to £2.8 million on-year, and share based payments charges grew from £0.1 million to £0.7 million.
Versarien comments
Commenting on the results, Company Chief Executive Officer, Neill Ricketts said,
“The year to 31 March 2019 has, again, been one of great progress for Versarien particularly in our emerging technologies businesses, globally and in the UK. The graphene businesses have delivered on our strategy of expansion into global markets and progress is being seen in our existing collaborations, as well as new collaborations being entered into. We look forward to showcasing our new technologies at future investor events.”
“Having spent some time examining opportunities for expansion into China, the Board concluded that the best one lies with BIGT and consequently signed a term sheet with them in April 2019. A wholly owned foreign enterprise is being established and will be managed by BIGT on behalf of Versarien, with planned investment from a BIGT managed fund. BIGT will focus on both the manufacture and sale of our graphene in China using our patented technology. “
“Opportunities in South Korea, Japan and India are emerging as a result of the support given to us by the UK Government seconded staff and we have established operations in North America, albeit they are at an early stage.”
“New graphene production equipment has been installed in the UK and is now up and running at our Cheltenham manufacturing site which will enable us to meet the initial expected demands of our graphene based products. Testing of new equipment is underway which, if successful, would expand our production capacity to up to 30 tonnes per annum of high quality graphene. Manufacture and sale of graphene at these levels requires certain permissions under EU regulations and I am pleased to report that we have been successful in our registration and are now accredited to produce significant volumes of graphene under the EU rules for chemical production.”
“Our mature businesses have focussed on efficiency gains and overall have returned acceptable results whilst also looking at opportunities for inclusion of graphene in their future products. This includes using graphene in headphones and mobile phone cases, through to producing Hexotene enhanced ceramics for use in satellite engines.
Sponsored Article
Over the past 18 months, the US dollar’s been on a tear.
And from a charting viewpoint, there’s been a clear trendline supporting the price since May last year.
Every time the price came down to test that trend line, the buyers came in and the dollar moved higher again.
When you see a market bounce like that at support, it’s the sign of a strong trend.
But when that support gives way, it’s a sign that the trend may be in danger of ending… and a new trend beginning.
That could be what we’re seeing right now, thanks to the Fed.
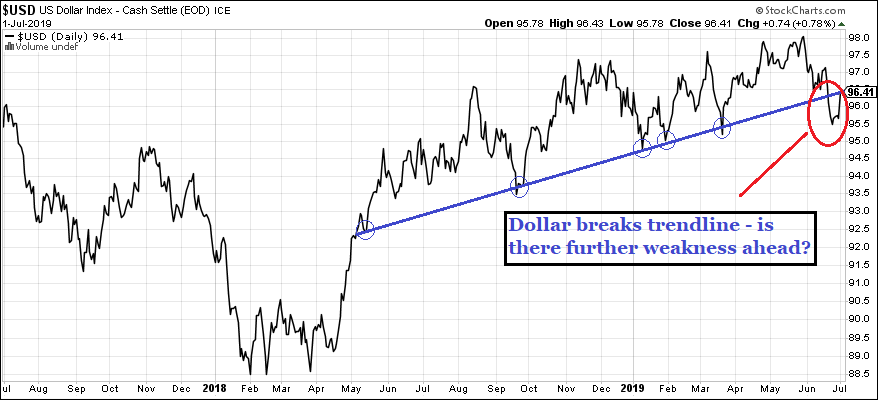
Below is a chart of the US Dollar Index. That’s a measure of the value of the dollar relative to a basket of international currencies, including the pound, the Euro and the Japanese yen.
You can see the blue trendline I’ve drawn showing the dollar bouncing on five separate occasions over the past year.
It shows the dollar has been strong in relation to other currencies.
That’s until 19th June (circled in red), where the dollar price breaks down significantly below the trendline for the first time April 2018.
Now 19th June is a significant date.
It’s the date of the latest policy announcement from the Federal Reserve.
The Fed left its key US interest rate on hold at the 2.25-2.5% range, as analysts had widely expected.
But its statement to the press following the announcement contained one important difference to recent policy statements.
Associated Press:
“… the Fed removed a reference to being “patient” about adjusting rates. That suggested that the Fed is now inclined to begin cutting rates for the first time in more than a decade.”
And with that, the dollar sold off.
That’s because if the Fed’s about to lower US interest rates, it makes the dollar less attractive to international capital seeking yield.
So, traders take ‘short’ dollar positions, where they aim to profit as the greenback falls.
It’s early days yet.
As you can see from the chart, although the dollar broke the trendline, it then bounced back to it.
Anyone familiar with technical analysis or charting will know that is what often happens after the break of a significant support line.
After the initial break, traders bid the price back up so that it touches and sometimes even breaks back above the trendline.
It’s a way of testing whether the breakdown was for real.
Remember, that trendline has acted as support for the dollar for more than a year.
Each time the price has dipped to the trendline, it has bounced.
So, now that it’s broken below it, a bunch of traders think that makes the dollar good value and are buying.
Meanwhile, there will be anther bunch of traders betting on the dollar falling. And now that it’s made that significant breakdown through support, they have good reason.
Time will tell whether there is further dollar weakness to come… or whether it was a false breakdown.
Meanwhile, as the dollar has been under pressure, commodity prices have soared in dollar terms.
Take gold as an example.
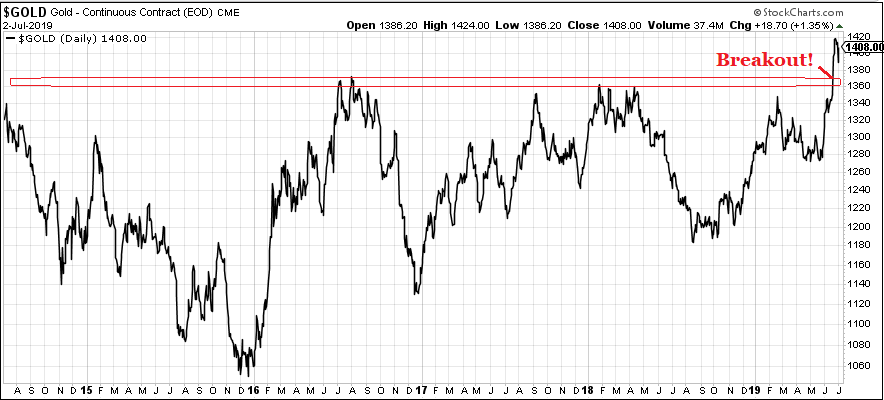
Here’s a five-year chart of gold priced in dollars.
The price has been contained by strong resistance at the $1,360-70 area for the past six years.
That is, until 20th June when it broke through and surged higher.
In fact, gold had been moving up before that, as tension between Iran and the US grew.
But it was the news of the Fed’s intention to cut rates that sparked the break to six-year highs.
As the dollar fell, gold rose.
And it’s been the same for the oil price, also priced in dollars.
Again, oil had been moving higher following Iran’s attacks on tankers in the Gulf of Oman.
But it was the Fed’s likely rate cut news that really sent it flying.
From $62 a barrel the day before the Fed, Brent crude moved as high as $66 over the following week.
Since then, the price has pulled back to around $63.
Oil is tricky to value right now from a fundamental viewpoint.
On the one hand, there is the outlook for a slowing global economy – the reason the Fed is planning to cut rates.
If economic growth slows, it will dampen demand for oil. That has caused the price to fall over the past couple of months.
On the other hand, OPEC countries such as Russia and Saudi Arabia are curbing production. That restriction on supply is supportive for the price.
At the same time, we have the ongoing tension in the Middle East which is also seen as threatening supply. Again, that’s also positive for the oil price.
What will be interesting is whether there really is an end in sight for the trade war between the US and China.
Following the G20 summit over the past week, there is hope talks will resume.
If that leads to positive resolution, oil should rally. But if Presidents Trump and Xi Jinping cannot reach an agreement and hostilities resume, oil could well fall.
With so much going on, it’s tough to make a call about where oil is heading in the medium to long term.
But that’s not to say there isn’t money to be made by trading it on a short-term basis.
And for that, it’s better to base your analysis on the price charts.
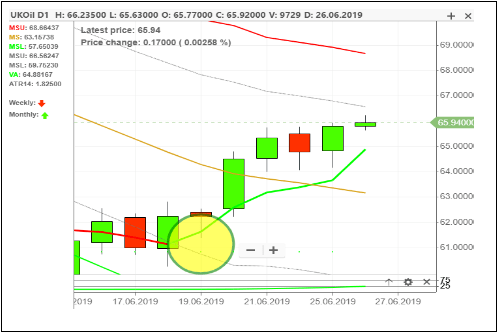
The Fed’s announcement on rates may have sparked the move higher in Brent crude oil on 20th June.
But our chart indicator pointed to a more sustained move to come. You can see it on the chart below. The green circle was the signal to BUY oil.
And as you can see, the price of oil moved higher, allowing our members to cash in on a 290-point gain in a few days. Based on trading at £3 per point, that’s enough to bank an £870 profit on one trade.
If you’d like to see exactly how to identify trades like this, please join us online for a live one-hour session.
British food manufacturer Premier Foods Plc (LON: PFD) looks set to meet expectations for the full year as the Company booked sales growth in the first quarter 2019.
For the 13 weeks ended 29 June 2019, Premier Foods saw total Group sales rise 1.1% and UK sales grow 2.6%. Branded sales grew 2.9% and 4.9% in these brackets respectively. The Group’s largest brand, Mr Kipling, saw sales grow 10% during the quarter.
The Company said that its campaign of increased marketing investment fro the year was already underway; with Mr Kipling and Batchelors already aired and more yet to come..
It added that it saw market share gains in 7 out of 8 of its top brands and that its expectations for the full year remained unchanged.
Premier Foods comments
Alastair Murray, Acting Chief Executive Officer of the Company, responded to today’s update,
“I am pleased to report an encouraging start to the year with Group sales up +1.1% and ahead +2.6% in the UK. As we previously noted, we are increasing our consumer marketing investment this year and both Mr Kipling and Batchelors have already benefited from TV advertising campaigns in the first quarter. Many of our largest brands have built on strong category positions and grown market share, and we achieved branded growth in the quarter of nearly 3%. These figures provide evidence that the Company’s strategy is delivering results. Our expectations for the full year remain unchanged.”
Commercial bank Arbuthnot Banking Group Plc (LON: ARBB) has seen its share price rally in morning trading on Wednesday after the Company posted significant year-on-year profit growth for the first half.
The Company’s H1 pre-tax profits jumped on a year-on-year basis, up from £1.2 million during H1 2018 to £2.9 million for H1 2019. Similarly, underlying profit before tax was up from £2.7 million to £3.4 million for the first half.
Arbuthnot also noted that customer loans grew to £1,275 million and customer deposits grew to £1,829 million during H1 2019, up from £1,097 million and £1,547 million respectively by the end of H1 2018.
Further, it added that it had raised £39.5 million of regulatory capital and agreed the purchase of the £266 million Mortgage Portfolio. However, while the Company’s Assets Under Management grew 4.5% from December 2018, they were down 4% year-on-year for H1, from £1,069 million to £1,029 million.
Arbuthnot Bank comments
Commenting on the results, Sir Henry Angest, Company Chairman and Chief Executive, said,
“The Group has had a good start to the year. We have raised new capital, grown our existing businesses and continued to deliver on our plans to diversify. We have also agreed to buy a mortgage portfolio which should help to improve the returns of the Group.”
Investor notes
The Company’s dividend per share grew from 15p for H1 2018, to 16p for H1 2019. However, earnings per share were down from 21.7p to 16.6p and net assets per share dropped from £15.40 to £13.21.
The Group’s shares have rallied 1.84% or 25p to 1,385p a share during morning trading on Wednesday 17/07/19 11:54 BST. Numis analysts reiterated their ‘Buy’ stance on Arbuthnot stock.
British chocolatier Hotel Chocolat Group Plc (LON: HOTC) posted impressive revenue growth in its full year trading update, for the year ended 1 July 2019.
With profits expected to be in line with market expectations for FY19, Hotel Chocolat revenues rose to £132 million – a 14% increase on FY18 revenues.
The Group’s strong performance was bolstered by the expansion of its outlet portfolio, with the Company opening 16 new locations during the year. The Company said these branches contributed 5% to sales year-on-year. It added that two of these store openings were in the US and two were in Tokyo, Japan, as part of a joint venture.
Hotel Chocolat comments
Angus Thirlwell, Co-Founder and Chief Executive Officer of Hotel Chocolat, said:
“I’m really pleased with our performance this year, delivering strong growth across all parts of the Hotel Chocolat multi-channel, direct-to-consumer model. New activities in the year included openings in the US and Japan; the launch of the Velvetiser – our in-home drinking chocolate system; and the introduction of our VIP ME rewards card scheme, all of which present substantial future growth opportunities.”
“Our pace of innovation is relentless. In our drinks and ices range we are seeing the most prolific new product Instagramming in our history, with Billionaire’s Sundaes, Choc Shakes and Vegan Chocolate-Dipped Lollies generating lots of excitement”.
Investor notes
The Company’s shares rallied 1.69% or 6p following the update, up to 361p a share 17/07/19 11:30 BST. Analysts from Peel Hunt and Liberum Capital have reiterated their respective ‘Buy’ stances on Hotel Chocolat stock.
Elsewhere, there has been news from other food and drink retailers; Distil PLC (LON: DIS), Coca-Cola (NYSE: KO), Patisserie Holdings Plc (LON: CAKE) and Kerry Group Plc (LON: KYGA).
Telit Communications PLc (LON: TCM), who describe themselves as a global enabler of the Internet of Things, has moved from a loss to a profit year-on-year for the first half, but has seen their net revenue narrow during the period.
Without providing a figure, the Company said,
“Profitability is expected to show continued improvement with a positive profit in cash.”
Whereas in H1 2018, the Company made a loss of $5.7 million in cash. Improvement was also seen in net cash. As of 30 June 2019, Group net cash stood at $44.0 million, up from $34.0 million at 31 December 2018.
However, while the Company’s continuing business revenue grew 7.2% from $167.5 million to $179.5 million for the first half, total Group revenue dipped from $201.7 million in H1 2018, to $189.5 million fro H1 2019. This was despite two months contribution from the automotive business, which was sold in February this year.
Telit Communications comments
Company Chief Executive, Paolo Dal Pino, stated,
“We are now a more efficient organisation, focusing on growing our industrial IoT products and services, while improving the overall profitability of the business. We remain on track with our operational and financial targets.”
The group’s statement added,
“The Group traded in line with the Board’s expectations for the first half and is on course to continue to do so for the full year.”